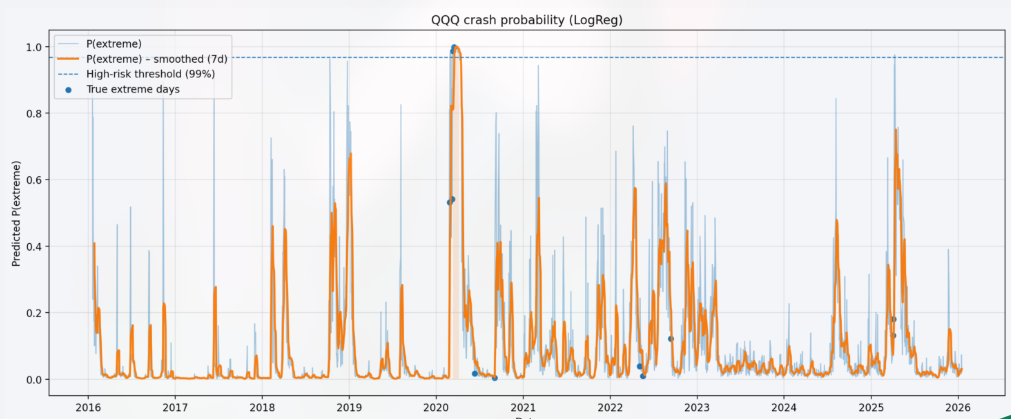
01 / PROBLEM STATEMENT
Why this work exists
Extreme downside days are rare, so random train/test splits and headline accuracy can create misleading confidence. The project tests whether only pre-decision information can identify QQQ tail events.
Data and source material
- QQQ daily OHLCV beginning in January 2000
- 6,431 engineered observations with 20 lagged features
- 55 extreme-day labels overall and 24 in the common out-of-sample window
02 / SOLUTION OVERVIEW
From input to usable output
Expanding annual walk-forward evaluation compares logistic regression, random forest and XGBoost using only pre-decision information.
- 01
Create a lower-tail return label
- 02
Build lagged momentum, volatility, VaR, trend, drawdown, and volume features
- 03
Train on expanding historical years
- 04
Predict the next calendar year
- 05
Evaluate probabilities with precision–recall metrics and an interactive explorer
03 / TECHNICAL ARCHITECTURE
Implemented components
QQQ inputs → features → yearly expanding splits → probabilities → evaluation dashboard
04 / METHODOLOGY & IMPLEMENTATION
Decisions that shape the system
- Rolling inputs are shifted by one day to keep predictors observable before each decision.
- Logistic Regression supplies a standardized linear baseline; Random Forest uses balanced subsamples; XGBoost uses shallow regularized trees.
- PR-AUC is primary because accuracy is dominated by normal days.
- The common comparison window contains 5,294 chronologically ordered out-of-sample predictions.
Implemented capabilities
- 20 lagged features
- 5,294 out-of-sample predictions
- Rare-event PR-AUC evaluation
- Interactive probability explorer
05 / RESULTS & EVIDENCE
What the source supports
- Random Forest: PR-AUC 0.0629 across 5,294 out-of-sample predictions.
- XGBoost: PR-AUC 0.0584; Logistic Regression: 0.0484 on the same window.
- The result is a rare-event classification comparison, not a trading-performance claim.
Results preserve the repository’s units, evaluation framing, and stated limitations. Missing evidence is not converted into a claim.
06 / CHALLENGES & LIMITATIONS
Where the evidence stops
- Only 24 extreme days occur in the common out-of-sample period.
- Conclusions are sensitive to the quantile-based crash definition.
- Evidence comes from one instrument and does not model execution frictions or a live decision process.
07 / WHAT THIS DEMONSTRATES
Engineering signal
Rare-event modelling, leakage control, walk-forward evaluation, appropriate metric selection, and restrained interpretation under a small positive sample.
08 / SOURCE & RELATED WORK
Trace the evidence
a516eca06674fe7a2612c35e98cd60d6a78c078e ↗README.md · docs/TECHNICAL_REPORT.md · docs/PROJECT_OVERVIEW.md · data/README.md