01 / PROBLEM STATEMENT
Why this work exists
A visually good curve fit does not establish forecast value. The research asks whether parsimonious and machine-learning term-structure models improve on persistence or mean reversion without seeing future information.
Data and source material
- Moroccan sovereign yield curves from Bank Al-Maghrib
- Euro-area AAA curves from the ECB
- U.S. Treasury yields for cross-market experiments
- Macro series with explicit unit and publication-date controls
02 / SOLUTION OVERVIEW
From input to usable output
A documented pipeline compares parsimonious factor methods with nonlinear alternatives and mean-reversion baselines.
- 01
Normalize units and align source calendars
- 02
Extract Nelson–Siegel or PCA factors at each forecast origin
- 03
Fit Dynamic Nelson–Siegel, regularized time-series, mean-reversion, and nonlinear alternatives
- 04
Generate expanding-window forecasts
- 05
Compare maturity and horizon errors with simple benchmarks
03 / TECHNICAL ARCHITECTURE
Implemented components
Python loaders and modelling modules
Saved methodology and phase reports
Regeneration-first output workflow
04 / METHODOLOGY & IMPLEMENTATION
Decisions that shape the system
- Nelson–Siegel represents each curve through level, slope, and curvature factors.
- Forecast pipelines use origin-local factor extraction, scaling, and tuning to prevent future leakage.
- Persistence and simple mean reversion remain first-class benchmarks.
- Overlapping forecast windows are handled explicitly in Diebold–Mariano comparisons.
Implemented capabilities
- Nelson–Siegel factors
- Dynamic forecasts
- Maturity-specific evaluation
- Cross-market comparison
- Long-horizon validation
05 / RESULTS & EVIDENCE
What the source supports
- The expanded BAM evaluation records one-year RMSE of approximately 64.6 bp for publication-time DNS, 64.8 bp for simple NS AR(1), and 67.1 bp for persistence.
- Persistence is best at the five-year horizon.
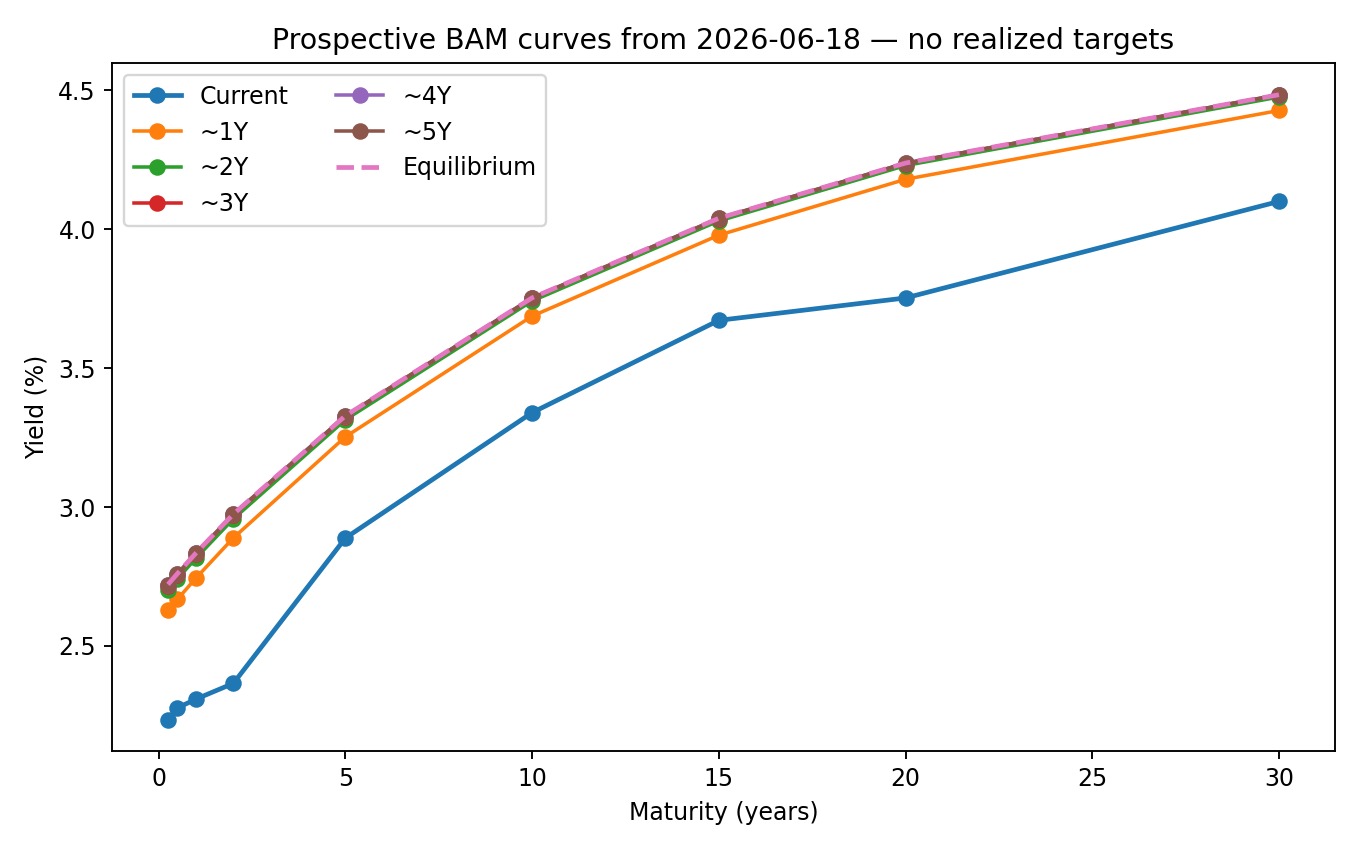
- The repository describes longer forecasts as equilibrium scenarios rather than precision pricing claims.
Results preserve the repository’s units, evaluation framing, and stated limitations. Missing evidence is not converted into a claim.
06 / CHALLENGES & LIMITATIONS
Where the evidence stops
- Overlapping long-horizon forecasts limit statistical power.
- Results depend on curve publication history, frequency, and unit handling.
- A small improvement over persistence does not imply a tradable strategy or precise bond-price forecast.
07 / WHAT THIS DEMONSTRATES
Engineering signal
Fixed-income modelling with careful data provenance, benchmark discipline, chronological validation, and honest interpretation of small performance differences.
08 / SOURCE & RELATED WORK
Trace the evidence
15b427fa940b105525de1abce49a2be7331a727d ↗README.md · dns.md · docs/PHASE1_RESULTS.md · docs/PHASE2_RESULTS.md · docs/PHASE6_ONE_TO_FIVE_YEAR_YIELD_FORECASTING.md